| Español |
|


| Millions of 2011 pesos | 2012 1 | 2012 | 2011 2 | % Change |
|---|---|---|---|---|
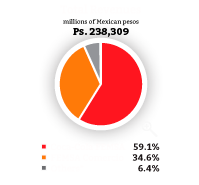
| Total revenues | 18,383 | 238,309 | 201,540 | 18.2% |
| Income from operations (3) | 2,255 | 29,227 | 24,484 | 19.4% |
| Consolidated net income | 2,164 | 28,051 | 20,901 | 34.2% |
| Controlling Interest (4) | 1,597 | 20,707 | 15,332 | 35.1% |
| Non-Controlling Interest | 567 | 7,344 | 5,569 | 31.9% |
| Total assets | 22,829 | 295,942 | 263,362 | 12.4% |
| Total liabilities | 6,617 | 85,781 | 71,191 | 20.5% |
| Total equity | 16,212 | 210,161 | 192,171 | 9.4% |
| Capital expenditures | 1,200 | 15,560 | 12,609 | 23.4% |
| Controlling interest book value per share (5) | 0.67 | 8.68 | 8.06 | 7.7% |
| Net controlling interest income per share (5) | 0.09 | 1.16 | 0.86 | 35.1% |
| Headcount (6) | 182,260 | 168,370 | 8.2% |
| 1 | U.S. dollar figures are converted from Mexican pesos using the noon-buying rate published by U.S. Federal Reserve Board, which was Ps. 12.9635 per US$1.00 as of December 31, 2012. |
| 2 | The figures for this year were restated for comparison with 2012 as a result of transition to International Financial Reporting Standards (IFRS). |
| 3 | Company's key performance indicator, calculated using IFRS figures. |
| 4 | Represents the net income that is assigned to the controlling shareholders of the entity. |
| 5 | Data based on outstanding shares of 17,891,131,350. |
| 6 | Includes headcount from Coca-Cola FEMSA, FEMSA Comercio and Other Business of FEMSA. |


* Includes other companies and our
20% economic interest in Heineken